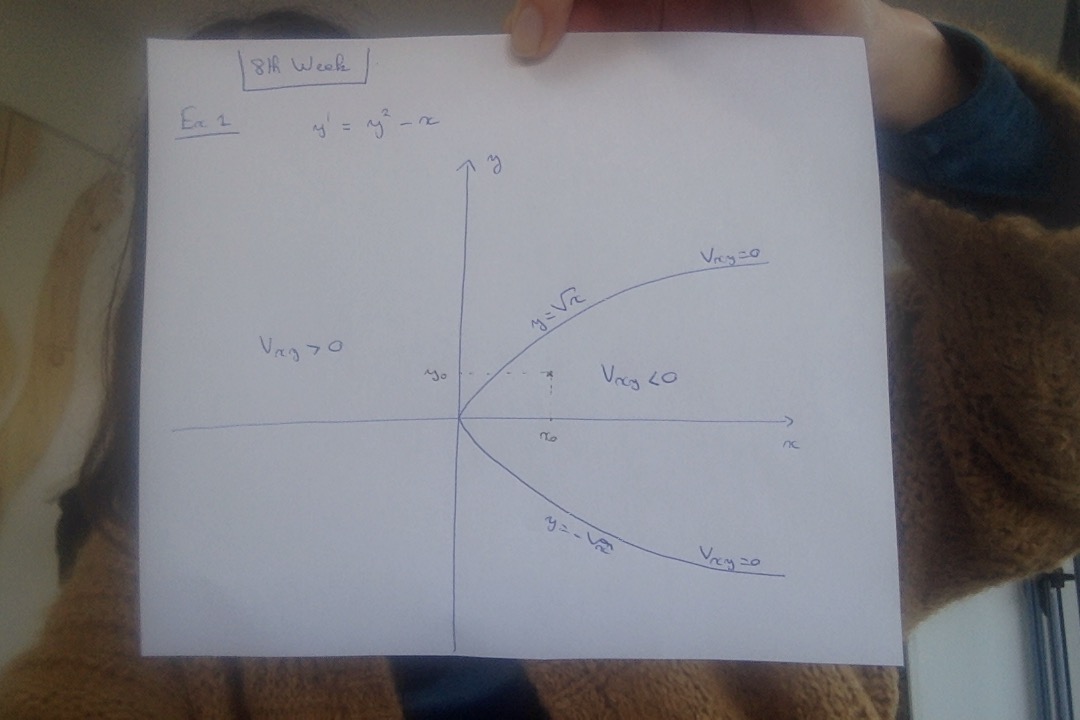
Visual explanation about exercise 1 question 1
You can find here illustrations of questions 1 and 2:
1/: the zones with V_xy positive, negative and zero
2/ the tangent fields associated, and the trajectories of 3 solutions (in green), starting from points inside the zone V_xy <0, and following the local tangent fields. You can see that the trajectories decrease, but are stopped by the bottom line V_xy = 0 that they cannot cross, since at this line the tangent is horizontal.
Click Photo le 18-03-2020 à 16.30.jpg link to view the file.